This page lists data visualisations that we have produced to illustrate results from the GlobalMass project.
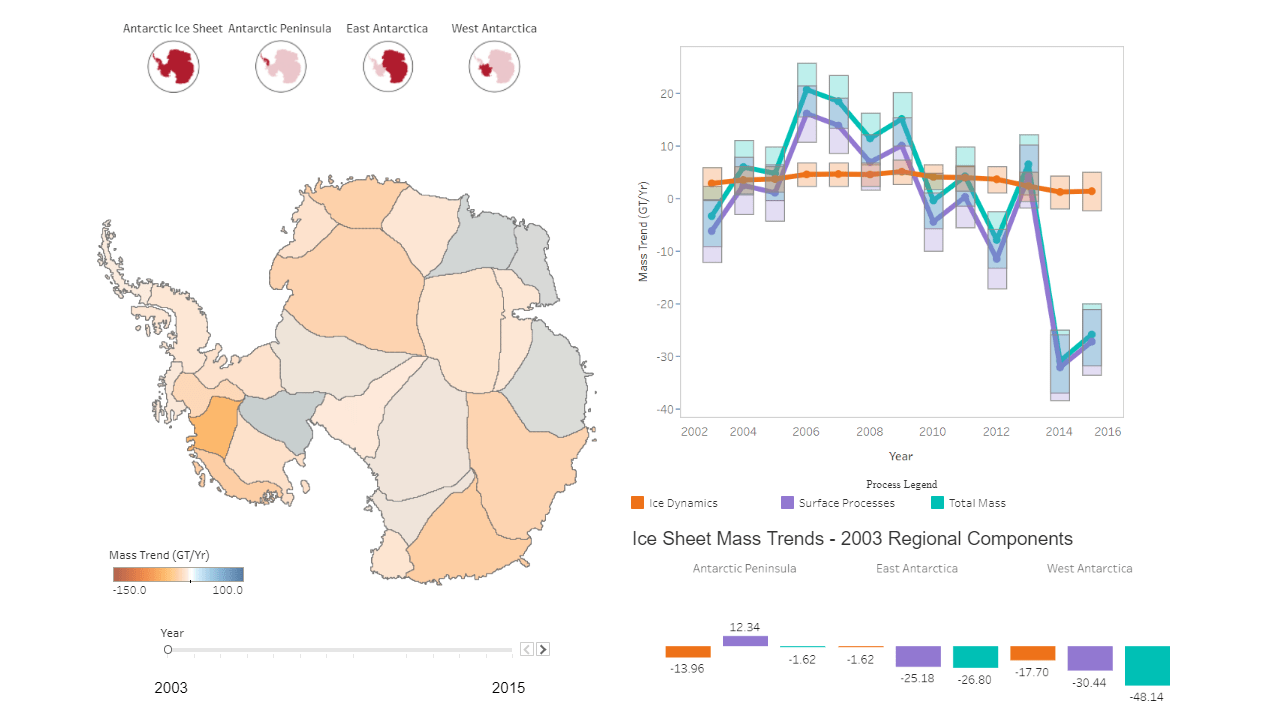
 | Antarctic Ice Sheet Mass Balance 2003-2015 Reference: Martín‐Español A, Zammit‐Mangion A, Clarke PJ et al. ( 2016), Spatial and temporal Antarctic Ice Sheet mass trends, glacio‐isostatic adjustment, and surface processes from a joint inversion of satellite altimeter, gravity, and GPS data, JGR: Earth Surface, 121, 182– 200 (doi:10.1002/2015JF003550). Visualisation: S Chuter (supported by seed corn funding from the Jean Golding Institute, University of Bristol). |
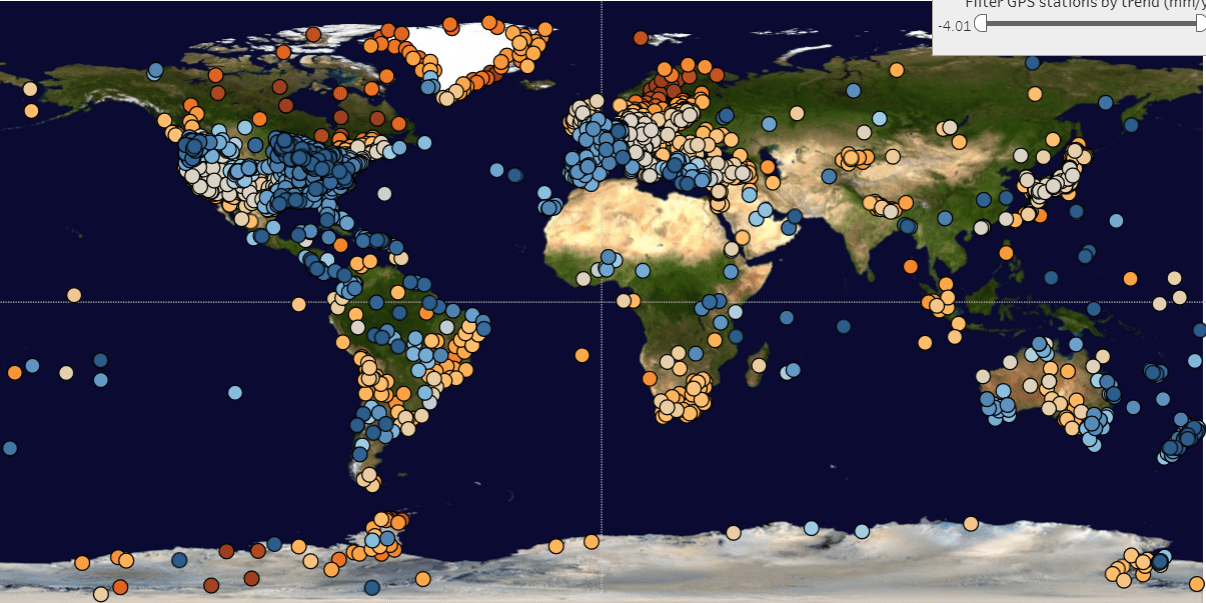
 | A new global GPS data set for investigating GIA Reference: Schumacher M, King MA, Rougier J, Sha Z, Khan SA and Bamber JL (2018) A new global GPS data set for testing and improving modelled GIA uplift rates, Geophysical Journal International 214(3), 2164-2176 (doi: 10.1093/gji/ggy235). Visualisation: RM Westaway |
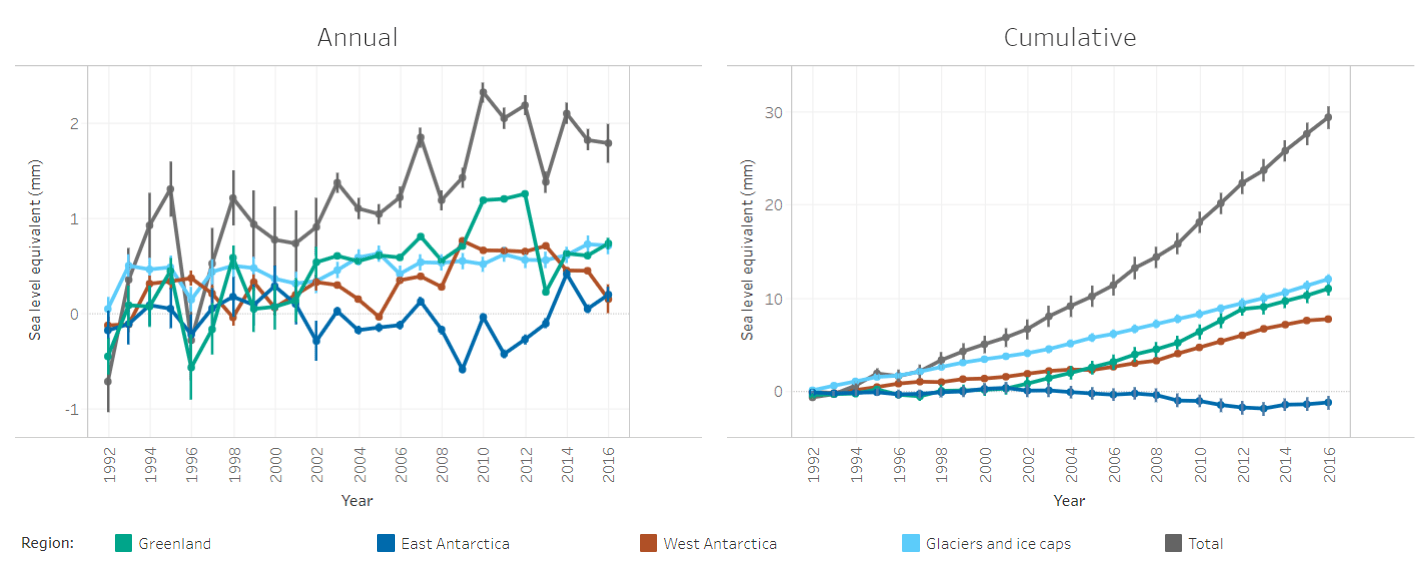
 | A new estimate of land ice contribution to sea level rise 1992-2016 Reference: Bamber JL, Westaway RM, Marzeion B and Wouters B (2018) The land ice contribution to sea level during the satellite era. Environmental Research Letters 13(6), 063008 (doi:10.1088/1748-9326/aac2f0). Visualisation: RM Westaway |
|
| Change in ice surface height of Antarctica between 2003 and 2012 due to ice dynamics (the flow of ice) and surface mass balance (SMB; the difference between snowfall and melt), based on the results of the RATES project. Reference: Martín‐Español A, Zammit‐Mangion A, Clarke PJ et al. ( 2016), Spatial and temporal Antarctic Ice Sheet mass trends, glacio‐isostatic adjustment, and surface processes from a joint inversion of satellite altimeter, gravity, and GPS data, JGR: Earth Surface, 121, 182– 200 (doi:10.1002/2015JF003550). Visualisation: S Chuter |
