The following blog post, written by GlobalMass team member Bramha Dutt Vishwakarma, first appeared on the blog of the Climate: Past, Present and Future (CL) Division of the European Geosciences Union (EGU) in October 2020 (https://blogs.egu.eu/divisions/cl/2020/10/16/sinkingoceanfloor/).
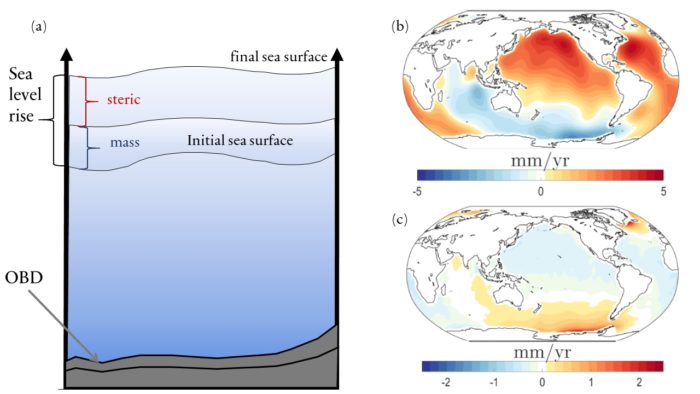
Sea level rise is one of most dreadful consequences of anthropogenic (caused by humans) global warming. It is estimated that the loss of coastal infrastructure alone would cost the global economy more than 1 trillion dollars per year by 2100 [1]. This number is based on climate models, but these are only as good as our current understanding of the sea level rise. Therefore, researchers are monitoring changes in the sea level as well as trying to understand the physical processes driving these changes. This type of analysis is known as studying the sea level budget (cf. Figure 1), wherein the observed sea level change is typically written in terms of mass change (from melting ice-sheets, river discharge) and steric change (mostly expansion due to warming) [2]. Many studies have used this budget approach to explain the global mean sea level change over the last few decades. The major takeaway from these studies was that in the second half of the 20th Century, steric sea level change was the dominant driver, although, in the last two decades, mass change has significantly increased and is now the dominant component [2].
Figure 1. A schematic of the sea level budget (a), the map (b) of GRACE observed rate of ocean mass change (mm/yr), and (c) is the corresponding ocean bottom deformation. Regions with increases in mass are subsiding, regions with decreases in mass are uplifting, but the global mean of ocean mass is increasing, hence the mean ocean bottom is subsiding.
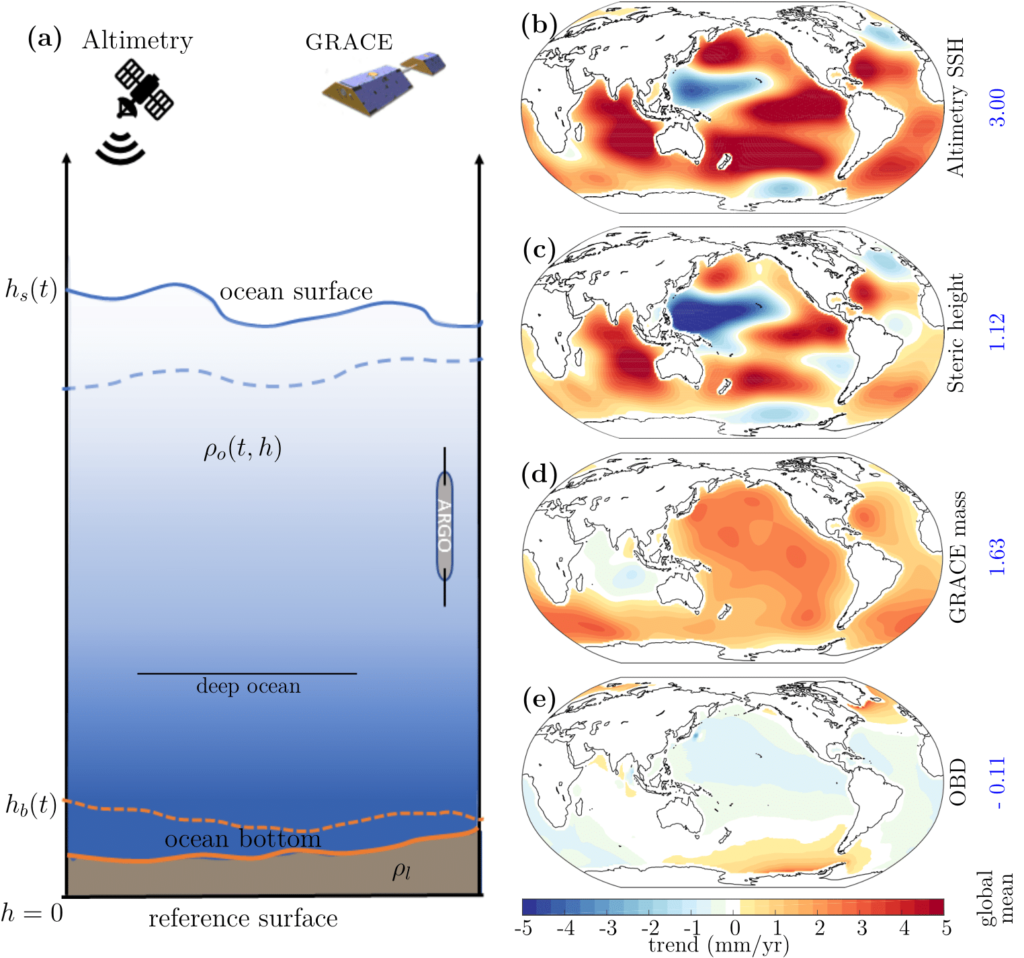
Additionally, there is another component of the budget that has been ignored until now and is becoming stronger and more significant with time, namely Ocean Bottom Deformation or OBD [3, 4]. It is defined as the change in the shape of the ocean floor due to increasing ocean mass. Our solid Earth is not as rigid as it may seem. It is visco-elastic, which means that when subjected to external force, it deforms, and when this external force is removed it resumes its shape, like a tennis ball [5]. Since ice sheets (Greenland and Antarctica) are losing mass and oceans are gaining mass, the Earth surface beneath the ice-sheets is slowly moving upward and the ocean bottom is sinking due to changes in the surface mass (load). This change in the shape of the ocean floor is usually an order of magnitude smaller than the rate of change in ocean mass [3]. Since the mass component of sea level rise was relatively small in the last half of the 20th century, OBD was negligible, but not anymore. The rate of observed sea level rise in the last two decades is reported to be approximately 3 mm/yr, out of which mass change constitutes 1.8 mm/yr, steric is 1.1 mm/yr and OBD is -0.1 mm/yr [3]. Therefore, the sea level budget is yet to be closed.
 Figure 2 shows an illustration of sea level rise and its budget components (a) on the left side. On the right you can see the observed sea surface height trend from altimetry data (b), the steric trend (c), the ocean mass trend from GRACE (d), and the Ocean bottom deformation trend due to ocean mass trend (e). Figure taken from [3].
Let’s take a step back and think about what is happening! We have emitted so much greenhouse gases that two of our largest ice-sheets are melting rapidly, adding so much mass to the oceans that the shape of the ocean floor is changing at a non-negligible rate. Let that sink in for a second! From the point of view of scientific analysis of sea level data, it is clear that we cannot ignore OBD in future scientific studies. In fact, we expect OBD to grow because the global temperatures are still rising and ice-sheets are shrinking. The next logical step is to understand the impact of OBD on future sea level. A sinking ocean floor: does it mean the risks in the future from rising sea level are lower than anticipated? The answer is NO; as the magnitude of OBD is only a small fraction of the sea level. Hence OBD is not a helping component, rather an indicator of how severe the sea level rise is.
References
[1] Church, J. A., Clark, P. U., Cazenave, A., Gregory, J. M., Jevrejeva, S., Levermann, A., Merrifield, M. A., Milne, G. A., Nerem, R. S., Nunn, P. D., Payne, A.J., Pfeffer, W.T., Stammer, D., & Unnikrishnan, A. S. (2013). Sea level change [Book Section]. In T. Stocker (Ed.), Climate change 2013: The physical science basis. Contribution of Working Group I to the Fifth Assessment Report of the Intergovernmental Panel on Climate Change. Cambridge, United Kingdom and New York, NY, USA: Cambridge University Press. https://doi.org/10.1017/CBO9781107415324.026
[2] WCRP, G. (2018). Global sea-level budget 1993–present. Earth System Science Data, 10, 1551–1590. https://doi.org/10.5194/essd-10 -1551-2018
[3] Vishwakarma, B. D., Royston, S., Riva, R. E. M.,Westaway, R. M., & Bamber, J. L. (2020). Sea level budgets should account for ocean bottom deformation. Geophysical Research Letters, 47, e2019GL086492. https://doi.org/10.1029/2019GL086492
[4] Frederikse, T., Riva, R. E. M., & King, M. A. (2017). Ocean bottom deformation due to present-day mass redistribution and its impact on sea level observations. Geophysical Research Letters, 44, 12,306–12,314. https://doi.org/10.1002/2017GL075419
[5] Farrell, W. E. (1972). Deformation of the Earth by surface loads. Reviews of Geophysics, 10(3), 761–797. https://doi.org/10.1029/RG010i003p007610
This post has been edited by the EGU editorial board.

Dr.-Ing. Bramha Dutt Vishwakarma is a Marie Curie research fellow at the University of Bristol, UK. His research interest lies in using Earth observation data and geophysical models to study the mass redistribution in the Earth system and their drivers. He tweets as @Bramha_tweets

